
No, POTUS, It’s Not ‘Raining’ Jobs

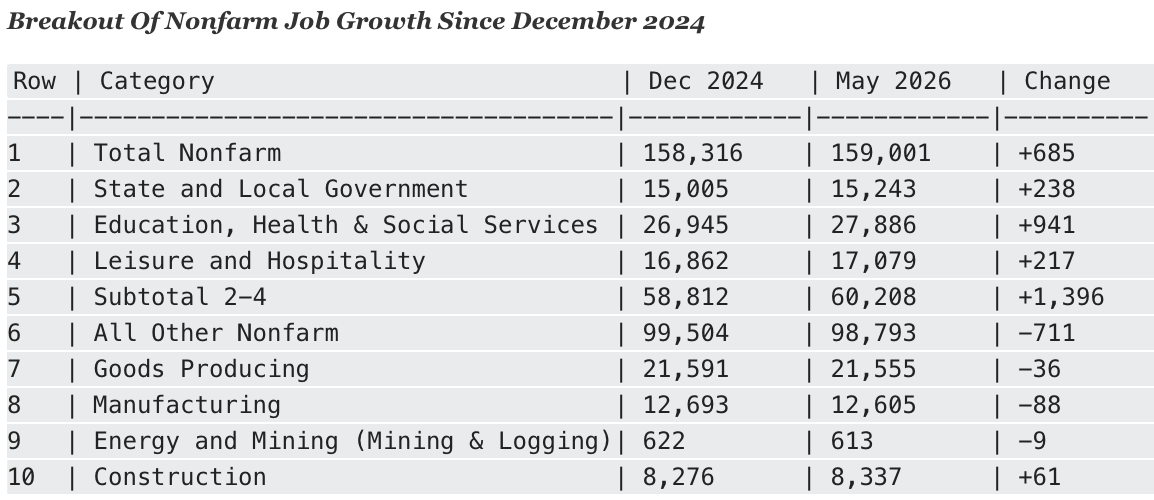
As we indicated in Part 1, the 40,000 “new jobs” per month posted during the Donald’s second term to date are nothing to write home about—especially when compared to the 329,000 per monthposted during Sleepy Joe’s snooze in the Oval. But the far worse part is that even the scant new jobs generated since December 2024 are in all the wrong places.
For crying out loud. Upwards of 35% or 238,000 of these so-called “new jobs” were in the already bloated state and local government sector, while 941,000 were in the heavily government financed education, health and social services sector.
Indeed, the later figure actually represented 137% or the total 685,000 job gain over the 17 months ending in May 2026. The entire balance of the US economy, therefore, has actually lost jobs since the Donald returned to the Oval Office for the second time.
In fact, aside from the nominal 217,000, or 1.3%, gain in the low pay, part-time waiters, bartenders and hotel maid sector (leisure & hospitality), the job count in the balance of the US economy has plunged by -711,000 jobs.
That’s right. Never once has even the MSM trumpeted that the vast bulk of the US economy—-accounting for just under 100 million jobs or nearly two-thirds of the total in December 2024—has shrunk by -42,000 jobs month-in-and-month-out ever since the Donald returned to the Oval Office.
At the same time, of course, the Donald has been pounding the main street economy with high tariffs designed to bring back manufacturing and goods-production including construction and mining and energy output. However, no cigar on that front, either.
Manufacturing jobs are actually down by a stunning -88,000 or 7% since December 2024—all the Donald’s Big Beautiful Tariffs to the contrary notwithstanding. And even with AI-driven data center construction bubble, the gain in construction jobs has been an extremely modest 0.7%, meaning that job growth in the overall goods-producing sector has been negative during the last 17 months.
In other words, the industrial sector recovery that the Donald promised would result from Trump-O-Nomics has not happened in any way, shape or form. The overall industrial jobs market is dead in the water. And that’s not HOT.
Needless to say, when it comes to overall economic health and sustainable prosperity, all jobs are not created equal. The latter embodies, in fact, the Keynesian fallacy that hiring men to dig holes with teaspoons and then fill them back up would help bring about the nirvana of so-called “full employment”.
Thus, what has been happening on the Donald’s watch is more in the category of government fueled bloat, not productivity based employment expansion. For instance, back in May 1959 before the Great Society and other Federal domestic grant programs had worked up a head of steam there was but one state and local bureaucrat for every 41 personsin the USA.
By contrast, there is now one state and local pay-roller for every 22 persons in the nation including men, women and children. There is not a snowball’s chance in the hot place, however, that the value of state and local government services has doubled. Or even that the quantity and quality of such services have improved at all.
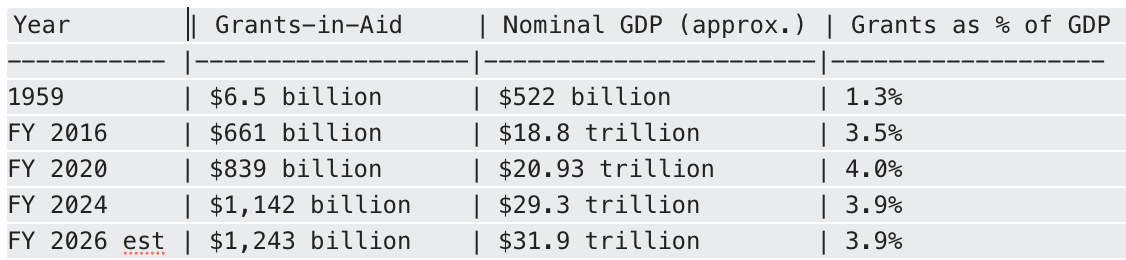
The irony is that the Donald started off his second terms with a budgetary bang via Elon Musk’s DOGE campaign, but that has vanished without a trace. In fact, when you look at the motor force of state and local government bureaucracy growth—-Washington grant-in-adds relative to GDP— it’s obvious why the Donald is bragging about creating so many government jobs.
To wit, he’s been the chief benefactor!
Back in the day when President Eisenhower was balancing the Federal budget and the enormous WWII debt was rapidly shrinking as a share of GDP (from 120% in 1945 to 50% by 1959), grant-in-aids totaled just $6.5 billion per year and amounted to just 1.3% of GDP.
Needless to say, that latter ratio grew year-in-and-year-out thereafter under Dem and GOP governments alike. Grants eventually reached 3.5%of GDP and$661 billion–or 100X more—under Big Spender Obama in FY 2016.
But when you consider what happened thereafter, you can’t say that the MAGA Hats weren’t warned. The Donald signed legislation during the next four years that raised grant spending by nearly $180 billion, to $839 billion and a record 4.0%of GDP by 2020. And, of course, that’s where the soaring state and local government headcounts came from.
Needless to say, the DOGE boys haven’t laid a glove on Washington’s out-0f-control grant spending. In fact, grant spending in FY 2026 is coming in $101 billion higher than the all-time record level Biden left on the table in 2024. So, yes, it’s not surprising that the job count is up on state and local payrolls, specially in blue states and cities from California to Boston—even if the latter do not have the manners to say
“thanks for the free stuff, POTUS.”
In this context, the booming level of job gains in private education, health care and social services is even more dubious. Again, given the overwhelming government share of financing—including tax preferences and credits—in these sectors, it is not surprising that the more the state spends, the more activity levels expand and employment levels rise.
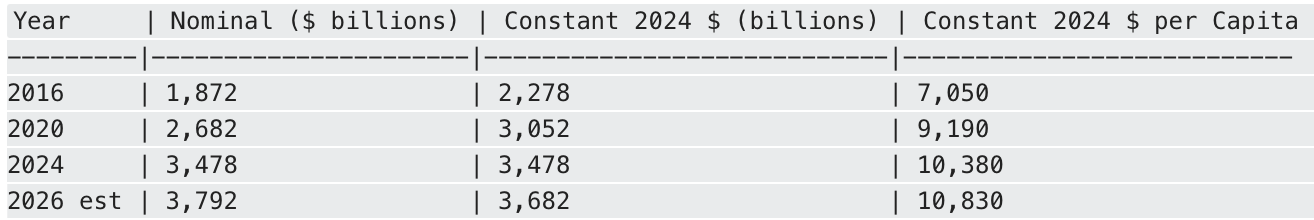
But what shouldn’t be happening is that this has occurred far more aggressively on the Donald’s watch than during Sleepy Joe Biden’s time in the Oval Office. As shown in the table below, constant dollar government financial support for these sectors has risen from $2.278 trillion in 2016 to $3.682 trillion in 2026.
However, 70% of this gain or nearly $1 trillion occurred during the Donald’s time in the White House. Even when you break these enormous figures down on a real per capita basis to account for both inflation and population growth, and then measure the result on a per year basis, the Donald is the hands-down winner of the government spending derby. During his six years annual government support growth was 45% higher than during the Biden years!
Real Per Capita Spending Growth per Year, Education, Health and Social Services:
- Biden Years: +$298.
- Trump Years: +$432
Total Government Spending/Tax Credits For Non-Public Education, Health Care, and Social Services
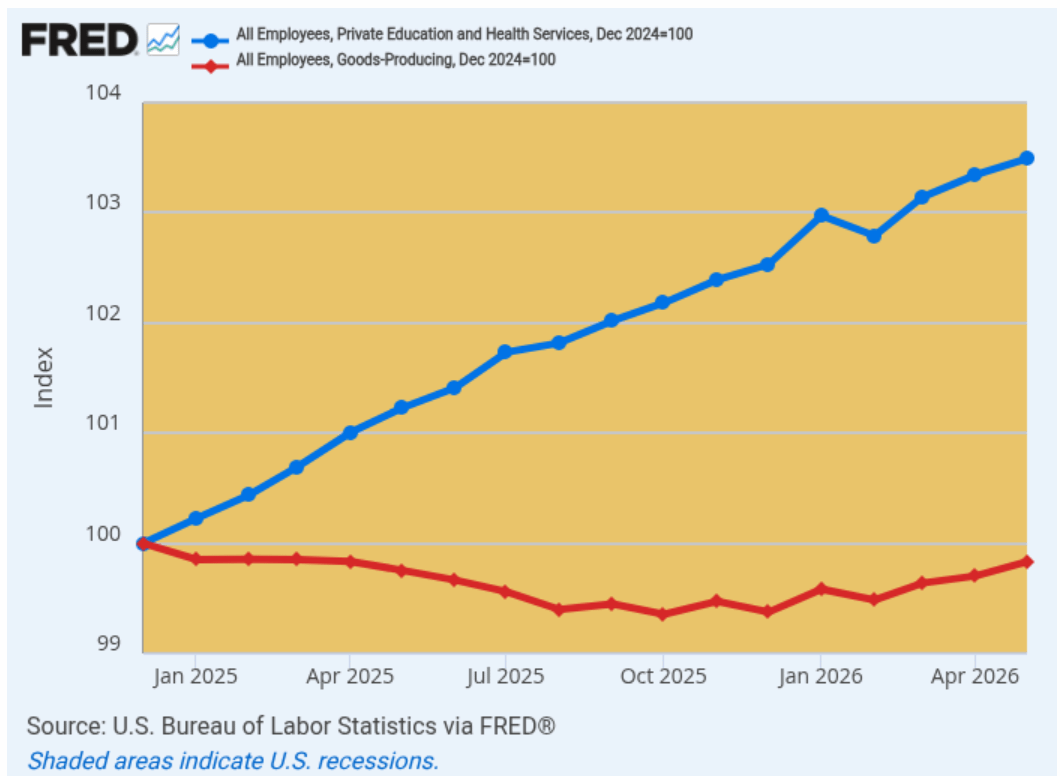
The following graph is not surprising therefore. Since December 2024 there has been no gain in good-producing jobs at all (red line), while employment in the fiscally-fueled education, health and social services sector has continue its long-running skyward climb (blue line).
At the end of the day, of course, the blue line in the graph below is funded by extracting taxes from current producers or borrowing the money and adding to the tax burden on future producers. Alas, up until the arrival of the New York real estate con man in a red jersey during the 2016 GOP primary campaign, no Republican—even the so-called RINO types— would have ever been bragging about the chart below.
So let us repeat: The jobs gains represented by the blue line have accounted for 137% of all the “new jobs” posted since the Donald returned to the White House in January 2025. But that’s surely not evidence of a HOT ECONOMY nor that the Trump Economy is RAINING productive jobs.
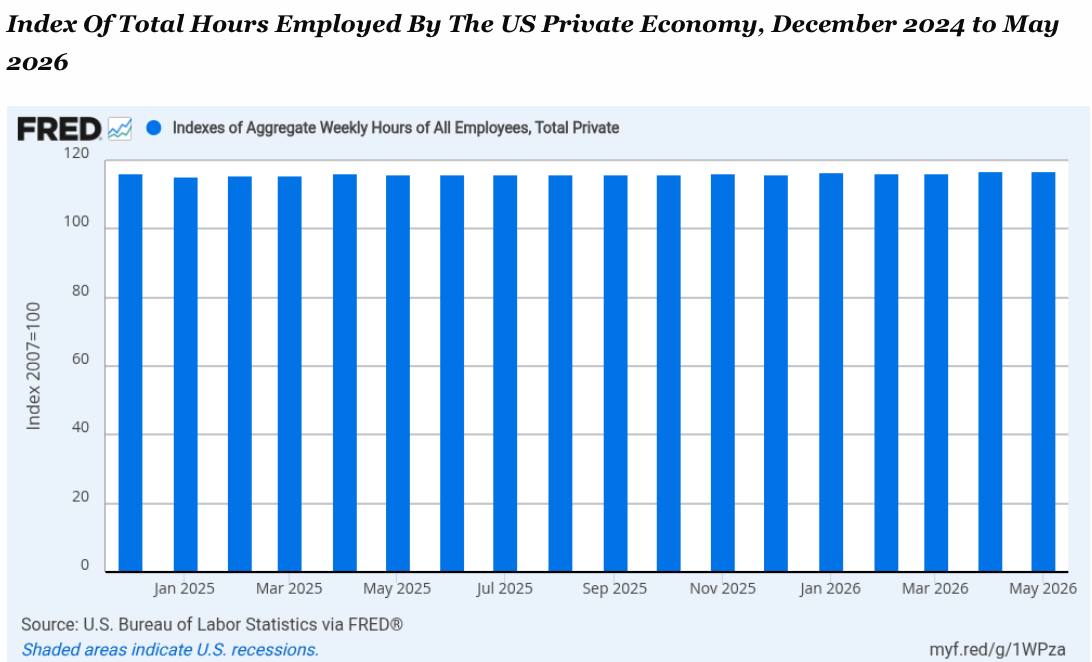
At the end of the day, economic growth historically had been fueled by labor hours growth and productivity. But during the Donald’s current stint at the helm total labor hour growth has been anemic on an aggregate basis and basically a by-product of government spending, borrowing and printing. As opposed to 2%+ annual growth of labor hours during the heyday of American prosperity in the second half of the 20th century, the growth rate of total labor hours employed has slipped to just 0.43% per annum since December 2025.
Our explanation for this anemic trend is this: The old time GOP religion that called for balanced budgets, sound money, free markets and small government was the true path to prosperity. And under the Donald, we ain’t remotely on it.
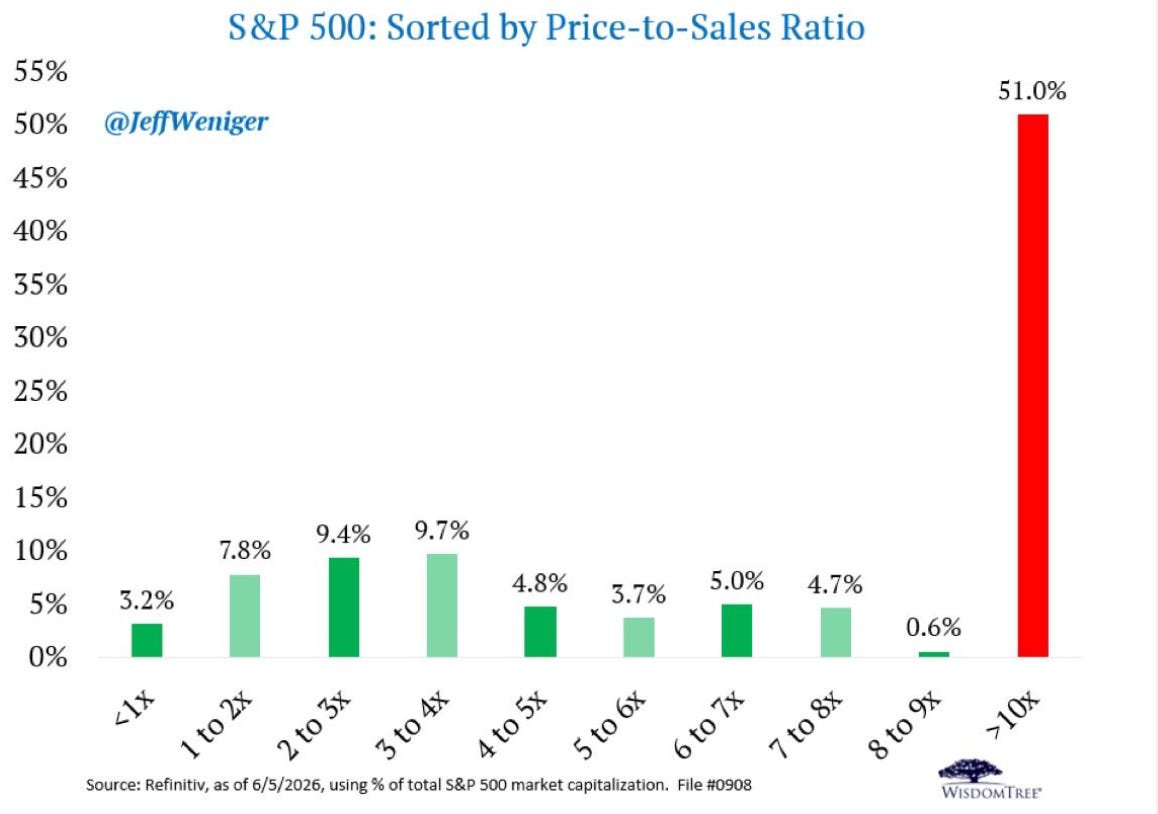
Meanwhile, the Fed fueled Wall Street bubble is reaching its apotheosis. As of this week, fully 51% of the S&P 500’s $68 trillion of aggregate market cap is accounted for by a handful of AI rocket ships and tech giants where market cap exceeds 10X sales!
So what we have is a disaster in the Persian Gulf, sitting on top of a debt-encumbered and inflation battered main street economy, which has been monkey-hammered by massive Trumpian tariffs—all fixing to be up-ended by a stock market crash that is surely close at hand.
And, that’s far, far and farther still from HOT in any meaningful sense of the word.
https://davidstockman.substack.com/p/no-potus-its-not-raining-jobs-part-89f