


Friday, July 03, 2026
You might think that nine Supreme Court Judges represent the finest minds, the most loyal Americans, and the most com...

Friday, July 03, 2026
July the 4th is a strange holiday. People who aren’t free to be left in peace are celebrating what, exactly? That the state only takes a fourth to ...

Friday, July 03, 2026
It has become very silent around the historic court case in the Netherlands against Bill Gates, Albert Bourla (CEO of Pfizer), former Dutch PM Mark...

Friday, July 03, 2026
Oligarchy is a very old system of governance and one we have never really escaped. More than 2,000 years ago, Aristotle stated that oligarchy (olig...


Wednesday, July 01, 2026
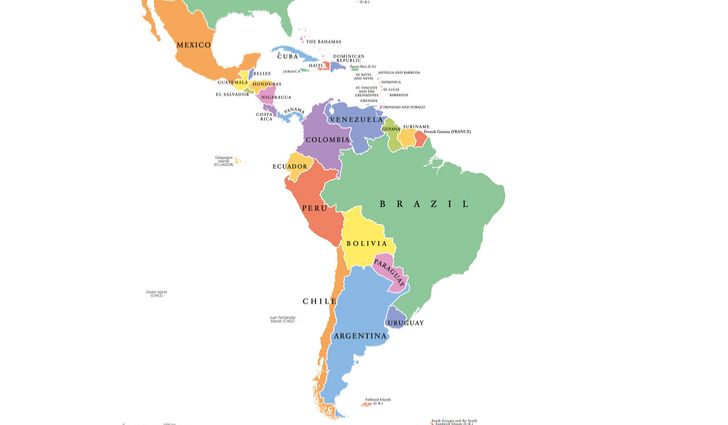
A decade of left-wing governance has collapsed as right-wing leaders pledge allegiance to Washington and Tel Aviv through the Isaac Accords framewo...

Wednesday, July 01, 2026
Recollections from the End of Empire.The 1st of July 2026 will mark the 29th anniversary of the handover of the Crown Colony of Hong Kong to th...

Wednesday, July 01, 2026
If modern history has taught us anything, it’s that one should never align one’s self with zealots. They might be useful for creating ...


Tuesday, June 30, 2026
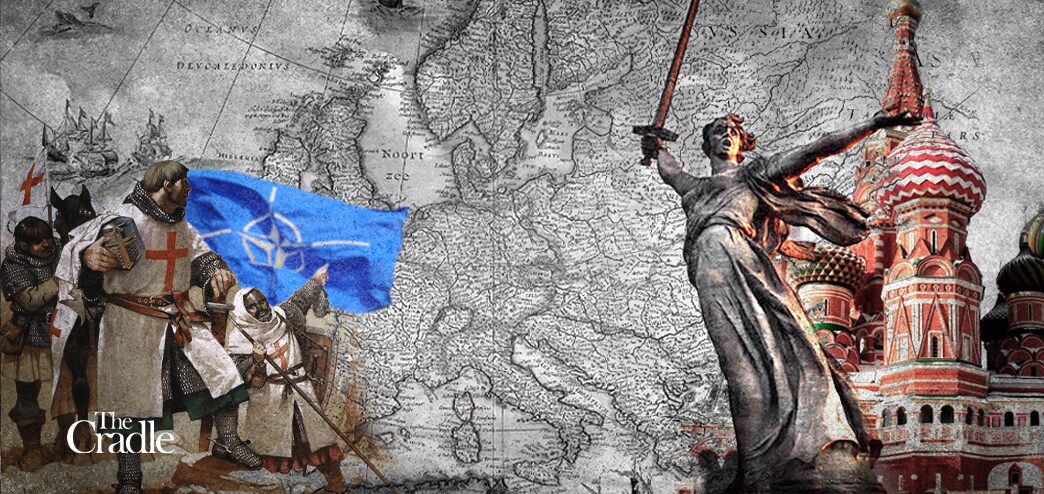
Russia has now made the strategic decision in response to prepare for war in Europe.The de-escalation framework that unfolded in the U.S.-Iran ...

Tuesday, June 30, 2026
Steadily lowering my social credit score.I sometimes have people ask me, “So what are you doing to help?” Sure, I’m full of radical t...
Tuesday, June 30, 2026
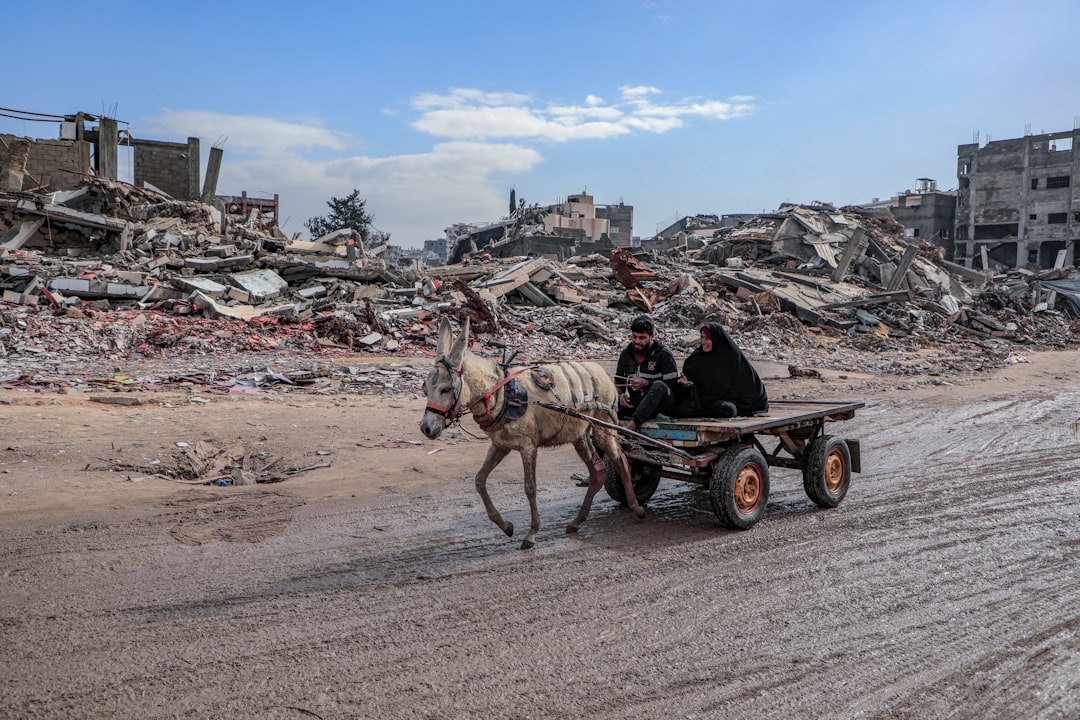
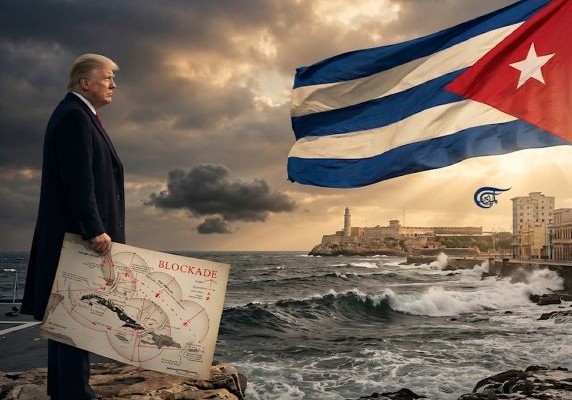
Despite intensifying US pressure and blockade measures, Cuba’s tradition of resistance, strong social organization, and decades of preparation agai...


Monday, June 29, 2026
As the disappointment after the Makerfield by-election sets in, the factions within Restore Britain have begun to go to war – but the truth i...

Monday, June 29, 2026
This is a foreword that I wrote for Lothrop Stoddard’s The French Revolution in San Domingo, published in 2011 but sadly out of print. Stoddard (bi...

Monday, June 29, 2026
Mass immigration, sex crimes and female empowerment.It’s a pretty sick joke. A young man from Syria or Morocco or Afghanistan risks everything ...