
Fiscal Disaster Ahead: Why Massie’s Loss and the Trumpification of the GOP Seals the Deal
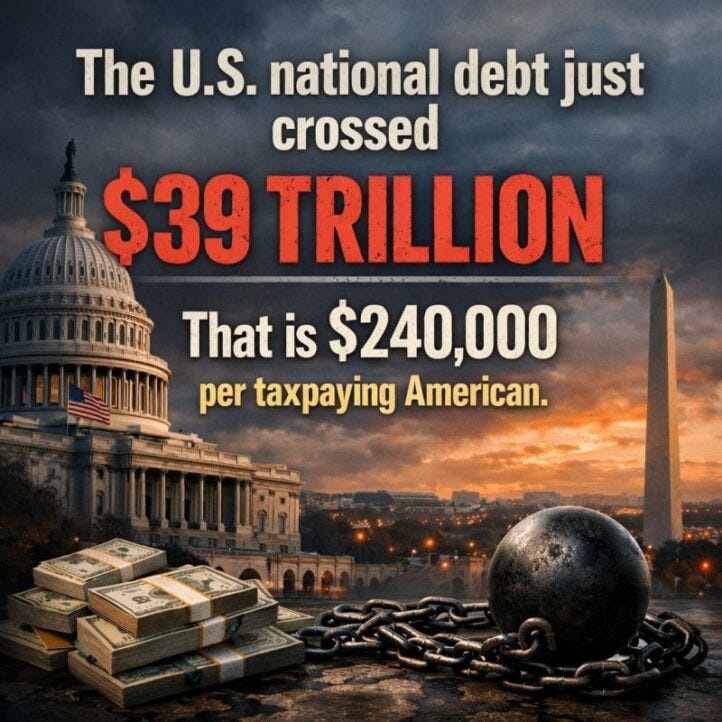
Last week’s Washington mayhem added powerful momentum to the fiscal doomsday path upon which the Federal government was already hurtling. To wit, the public debt crossed the $39 trillion threshold or more than double where it stood in January 2017 when the Donald unfortunately rolled into town the first time.
Already, in fact, after one full term and 511 days of the second one, the public debt has grown by $11 trillion on the Donald’s watch alone. That’s nearly 40% of the total debt racked-up by his 45 predecessors during the first 235 years of the American Republic.
But that makes no never mind to the King of Debt. He spent a good part of last week either plotting to spend another $2 billion per day on his insane war on Iran or taking bows for defeating the most heroic advocate of fiscal sanity to serve in the Congress since Ron Paul and Rand Paul—-Congressman Tom Massie.
And need we also mention that the $20 million of outside money that defeated Massie in the dark red 4th District of Kentucky came from the Bibi Netanyahu/neocon Fifth Column. The latter, of course, wants a 50% increase to $1.5 trillion in the already hideously bloated DOD budget in order to better prosecute Forever Wars when, if and as demanded by said Fifth Column.
Still, for the manana crowd, the significance of the per capita debt equivalent at $240,000shown in the graph should not be gainsaid. If you dial back barely 114 years to 1912—before America had a Warfare State, a Welfare State, an income tax or a central bank—the public debt stood at just $2.8 billion!
That’s right. It barely amounted to $30 per capita. Moreover, when you give the money-printers at the Fed, which was created the very next year, its due and adjust the debt figure to inflated 2026 dollars, it amounted to just $900 per capita.
No zeros omitted! In today’s purchasing power.
So yes, the US population has tripled since then, but the fact remains: On a per capita basis the figure that the modern UniParty—topped of by 1,971 days of the King of Debt in the Oval Office—has generated is 270 times larger per capita in constant dollars.
Yet that’s hardly the half of it. Owing to nearly two decades of severe interest rate repression by the Fed after the 2008 financial crisis, the weighted average yield on the publicly held portion of the debt, which now stands at about $31 trillion, is just 3.22%.
But here’s the thing. If that $31 trillion were to be refinanced at today’s interest rates–ranging from 30-day T-bills to 30-year bonds and TIPS, the weighted average would be 4.15%.
And the latter reflects today’s market before the in-coming inflation and debt storm from the Donald’s bomb, spend and borrow campaign fully hits the bond pits. Yet even now it would cost an additional $242 billion per year just to pay the interest on the current publicly-held debt.
The fact is, however, the Dem wing of the UniParty falsely claims that this yawning fiscal gap can be closed by taxing the top 10% of households harder, when they are already paying 70% of total income taxes collected by Uncle Sam. At the same time, the Trumpified GOP promises no cuts in Social Security, Medicare, Veterans or farm programs and a $500 billion per year increase in DOD spending—all on top of the unpaid for $4.7 trillion cost of OBBBA enacted last July.
Alas, when you add in more than $1 trillion per year for current interest payments, the Trumpified GOP has ring-fenced upwards of 90% of total Federal spending. So you couldn’t assemble even a corporals guard in the Republican caucus to cut spending by enough to cover even the added $242 billion of annual interest costs embedded in current market yields.
That’s right. What we have is a fiscal Doomsday Machine, where the rollover of the current $31 trillion of publicly held debt to current market interest rates will generate more added spending than can be cut by any plausible version of the political future under the Big Spending Dems and the debt-addicted Trumpified GOP.
For want of doubt, it is useful to review the table below, which shows the current Federal debt by maturity tier. Thus, the part of the debt currently bearing coupon yields near market rates is the $6.6 trillion or 21% of the $31.8 trillion total that matures in one-year or less.
By contrast, older debt bearing maturities of 7-years or more + TIPS—most of which was issued during the Fed’s post-crisis print-a-thons—totals $14.3 trillion. Yet here the gap between present coupons and current market rates is huge. Current interest expense of $426 billion per annum on these debt securities would rise by +42% to $606 billion just at current market yields on comparable notes and bonds.

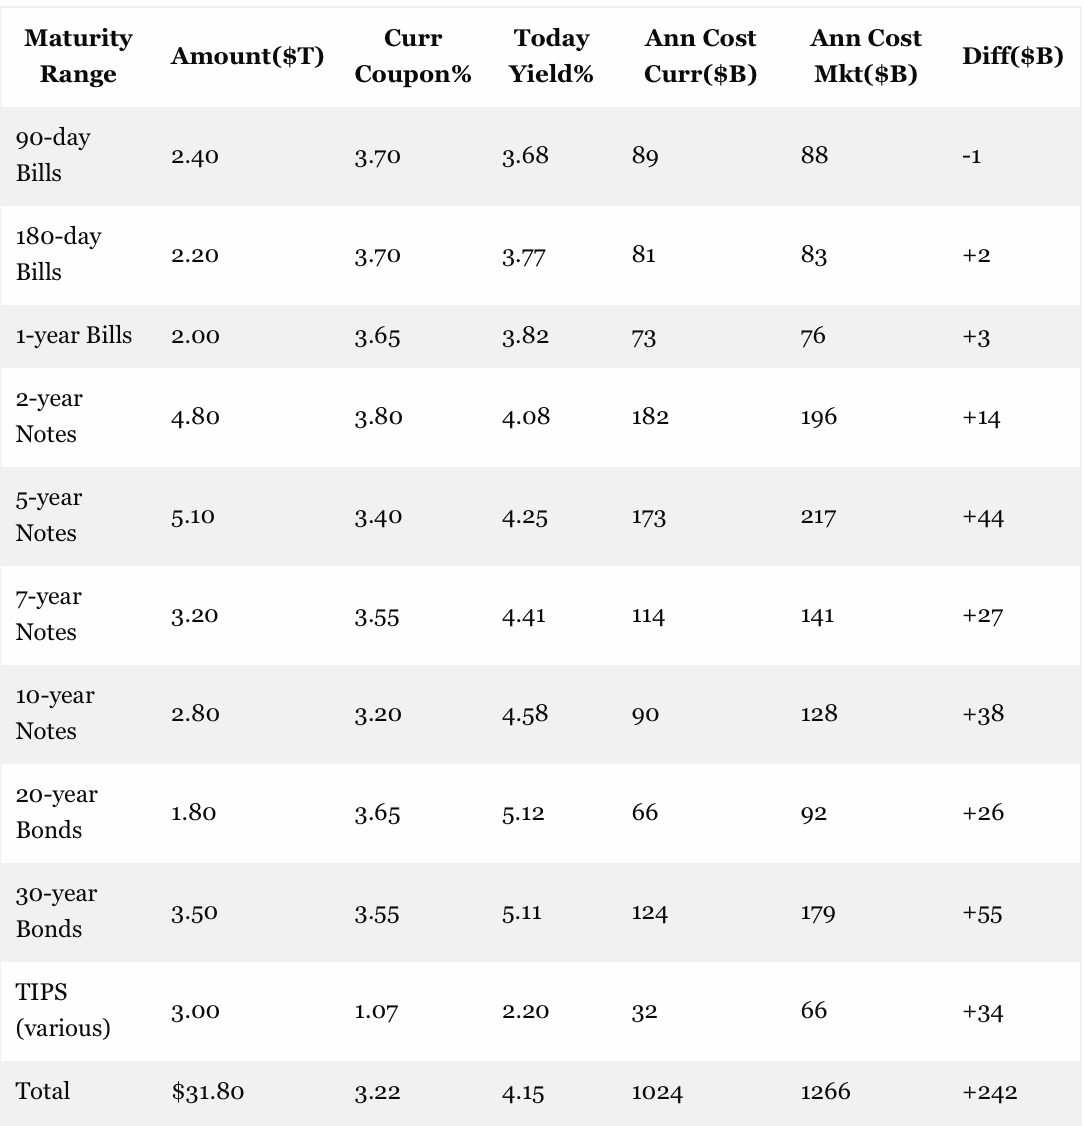
Needless to say, the risk of soaring interest expense when these securities rollover is huge. For example, the weighted average coupon on outstanding 30-year bonds is 3.55% but the comparable market yield presently is 5.11%. Accordingly, interest expense on a rollover to current market yields would rise by +44% on the long bond alone.
Of course, the Donald and his shills would have you believe that the current 30-year yield at 5.11% is way too high, meaning that the Fed needs to hit the printing press accelerator and bring it down. Yet when you look at that nominal yield relative to inflation—which is now pushing 4% on a Y/Y basis— the current yields is actually subnormal, not way too high.
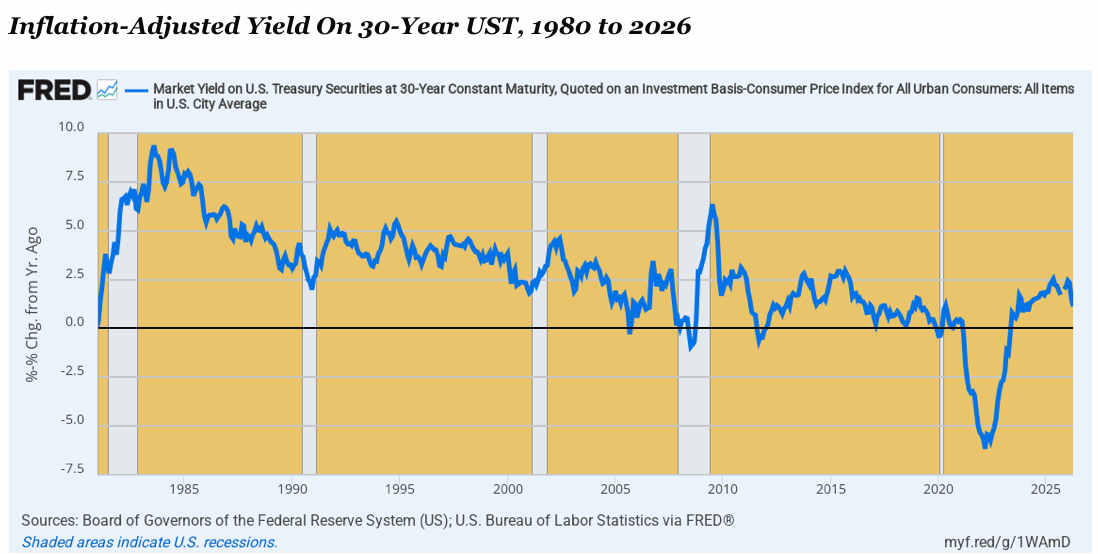
Thus, in April, the inflation-adjusted yield on the 30-year bond at market weighed in at just 1.13% compared to 2.5%-to 5.0%, which was pretty much the norm during the growth heydays of the mid-1980s through the pre-crisis peak in 2007. That is to say, at current inflation levels, the normalized nominal yield would be more like 7% under historic real rates; and the rollover cost of the current $3.5 trillion of 30-year outstandings would be nearly $250 billion or double the current carry cost on these bonds.
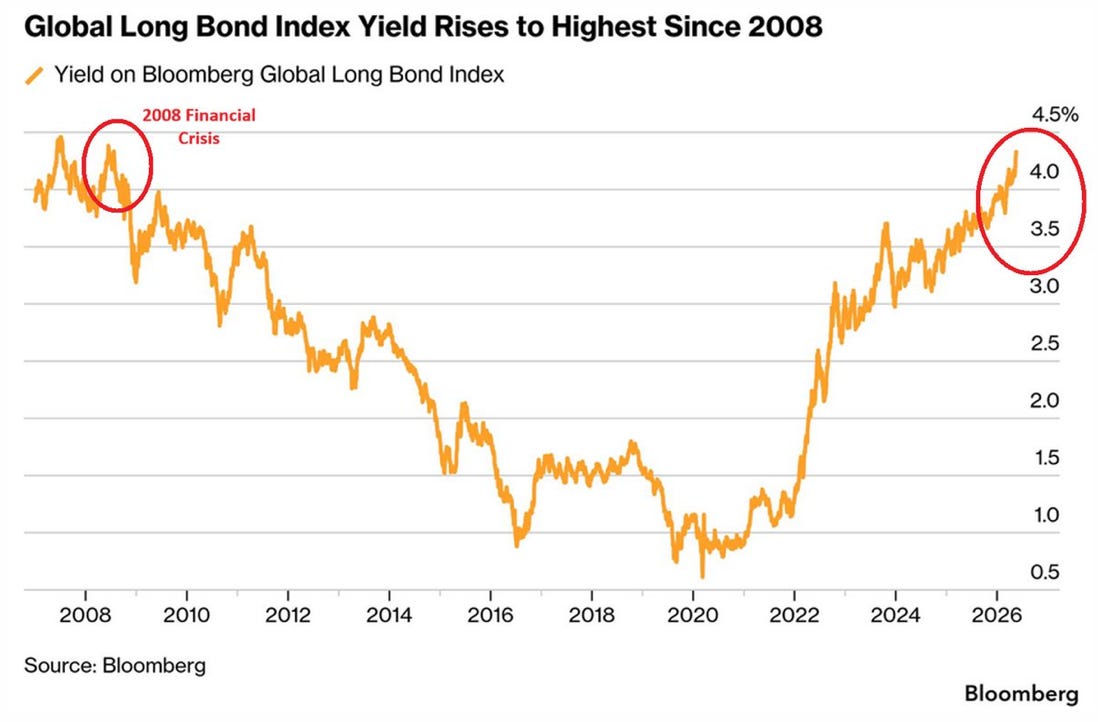
In any event, there is absolutely no doubt that the direction of travel on longer-term bond yields is higher—much higher. What happened during the 14 years between the peak of the 2008 financial crisis and the post-pandemic central bank print-a-thons was the most egregious spree of central bank-induced mispricing in bond market history.
Accordingly, weighted average global yields plunged from ~4% or higher in 2008, at a point in which yields were barely above inflation rates, to the ~1.0% sub-basement level during 2020-2022. These yields, of course, were hideously false and unsustainable: In the case of the 30-year UST, as shown above, the real yield plunged to -5.0% or below.
This was the product of utterly foolish money-printing at the central banks, which reckless monetary expansion took the combined balance sheets of the world’s central banks from $7.7 trillion in 2006 to a peak of $44.1 trillion in 2021. That’s a stupendous growth rate of 12.4% per annum, and as a practical matters means that the major central banks of the world—the Fed, ECB, BOJ and Peoples’ Bank of China—monetized more than $36 trillion of mostly government or other sovereign debt securities during that period.
Needless to say, the central banks led by the Eccles Building printed themselves into an inflationary storm that finally forced most of the printing presses back to idle. And, yet, as the graph below makes clear, once the big fat thumbs of the central banks were taken off the scales in the bond pits from New York to Tokyo, nominal yields have been marching uphill—ever more fully reflecting the huge imbalance worldwide between the supply of savings and the demand for government and other long-term finance.
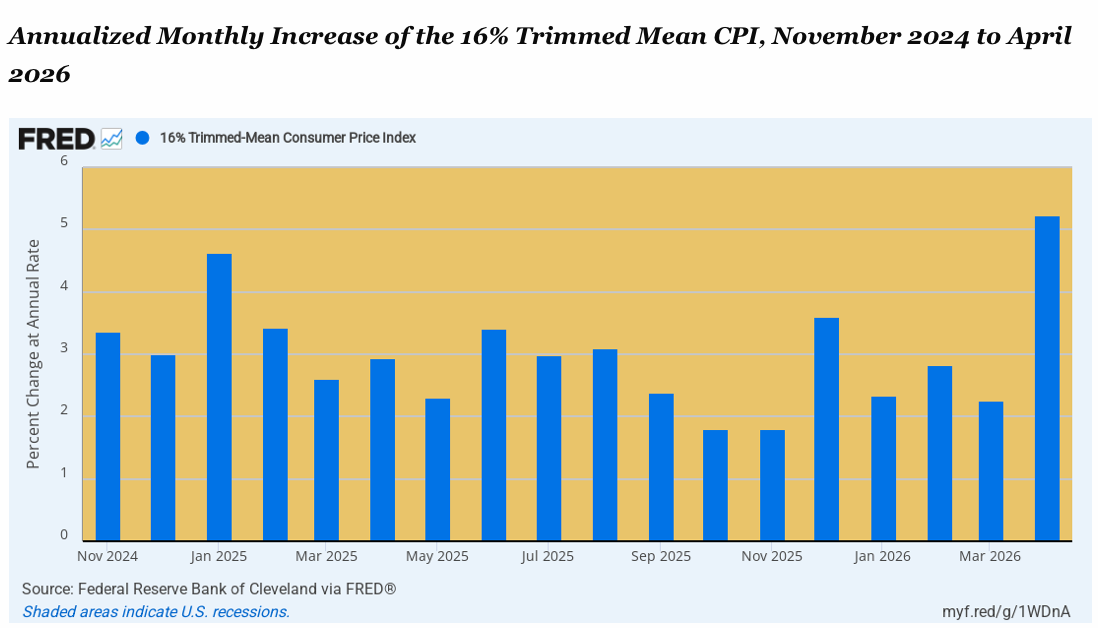
In any event, with inflation at 3.3% during the last five months and trending higher (5.22% at annual rates in April) on our trusty 16% trimmed mean CPI, we do not see any realistic scenario in which the weighted average yield on the federal debt does not continue to trend upward.
And that will be especially true on the short end where most of the outstanding USTs are now positioned (see table above). Yet the Fed will have no choice except to allow the Fed funds rate to rise as the typhoon of soaring energy and commodity prices rolls in from the Persian Gulf.
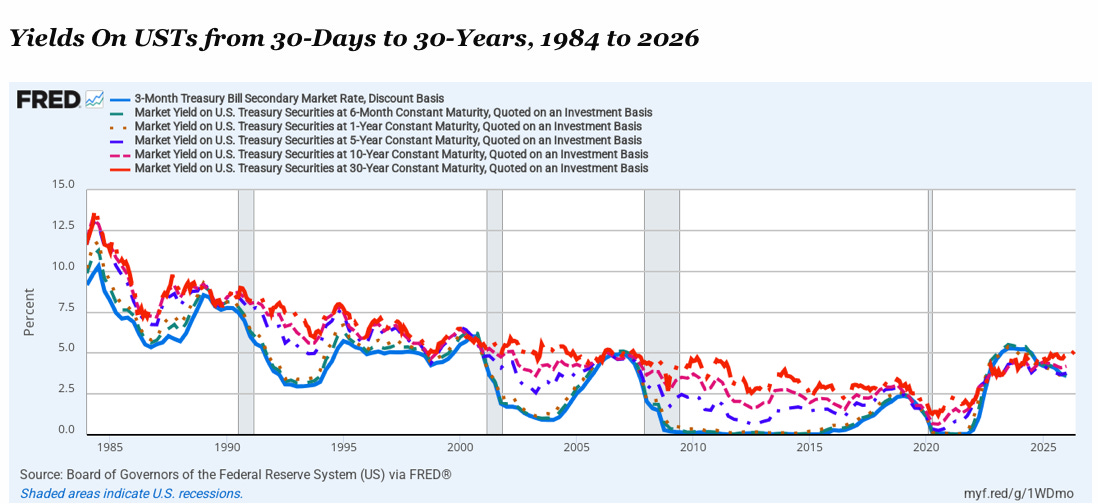
For want of doubt, here is a longer term view of yields on USTs ranging from the 3-month bill (blue line) to the 30-year bond (red line). It is abundantly clear that with higher inflation, on the one hand, and massive new Treasury supply to fund the Donald’s Iranian War and expanding Warfare State, plus the baseline Welfare State and the $4.7 trillion of additional debt during the next ten years from OBBBA, on the other, current nominal yields have not topped out by any means.
In fact, based on history, there is easily 2oo-3oo basis points of higher yield readily possible in the period ahead.
To be sure, the White House is under the illusion that the inflationary tidal wave coming in from the Persian Gulf won’t hit these American shores owing to the mantra of “drill, baby drill,” which has made the US a booming net exporter.
Of course, under the law of a single price in global markets owing to relentless trader arbitrage between and high and low price markets around the planet, the fact that the US is a net exporter does not shield the gas pumps in Lincoln Nebraska by a single dime per gallon from the the global petroleum price surge.
Beyond that, however, the soaring level of US net exports since the onset of the Iran War on February 28 isn’t what its cracked up to be, anyway.
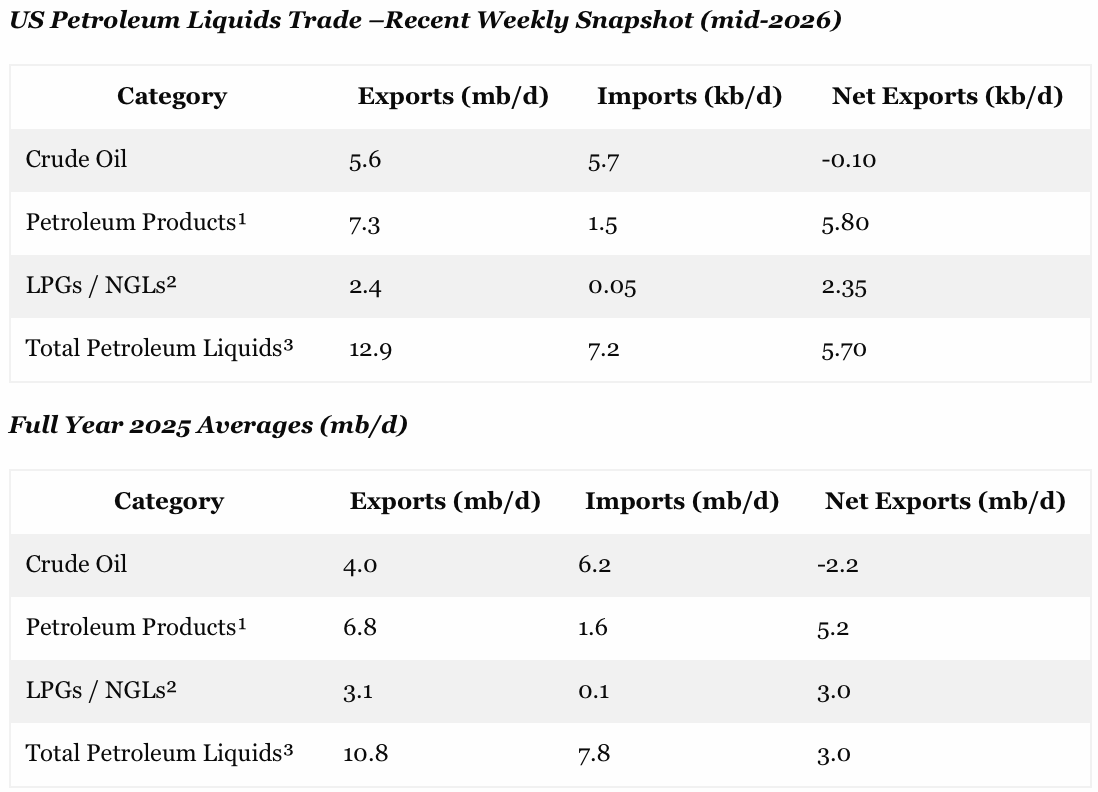
The first table below, shows a snapshot of petroleum liquids imports, exports and net balance for the weeks of April and May, reflecting the full impact in global markets of the drastic curtailment of supplies from the Persian Gulf. As the table shows, exports have hit an all-time high of 12.9 mb/d,which total is heavily driven by refined petroleum products and natural gas liquids.
At the same time, imports have fallen slightly from 2025 pre-war levels (second table below), resulting in a 5.7 mb/d net export level. As is shown in the second table, the net export level was just 3.0 mb/d during the 2025 baseline period, meaning that net exports have grown by 2.7 million barrels per day since the inception of the war.
Alas, however, nearly 50% or 1.3 mb/d of that gain is owing to the Donald’s fire sale of US strategic petroleum reserves to the highest bidders on the world market—especially from Pacific Rim industrial economies normally heavily dependent on the Persian Gulf. In fact, the SPR is being draw down at such a rapid rate that the practical minimum operating level of 200 million barrels will be reached in just a few months.
In short, the powerful arbitrage forces of the global petroleum markets are fully at work. Both higher US crude exports from current production plus a heavy draw on SPR reserves are together re-balancing the global market at the current +/- $100 per barrel range. Consequently, if the war doesn’t end almost immediately—and there is little prospect of that given the Donald school boy antics—it is virtually certain that the world price will push far higher, toward $150 to $200 per barrel, as normal working stocks continue to be rapidly and deeply depleted.
In turn, that means “drill baby, drill” is not a magic silver bullet, at all. The Donald’s war policy guarantees an inflationary energy and commodity storm on a global basis—so there will be no respite at the Lincoln Nebraska gas pumps regardless.
¹ Includes gasoline, diesel, jet fuel, etc.
² Propane, butane, etc. (subset of products).
³ Crude + Products.Net Exports Comparison (mb/d)
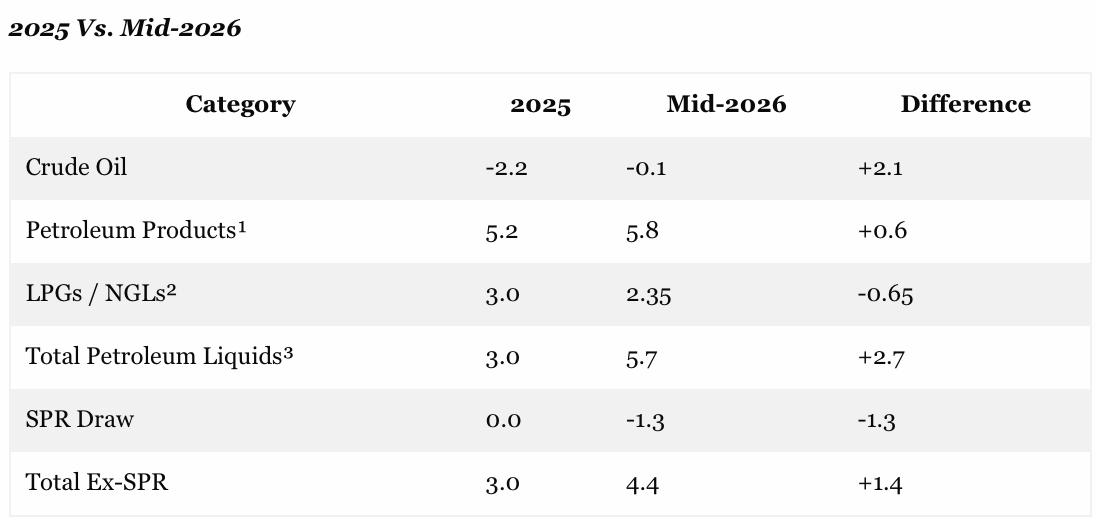
Data Sources: U.S. Energy Information Administration (EIA). Mid-2026 based on recent weekly averages.
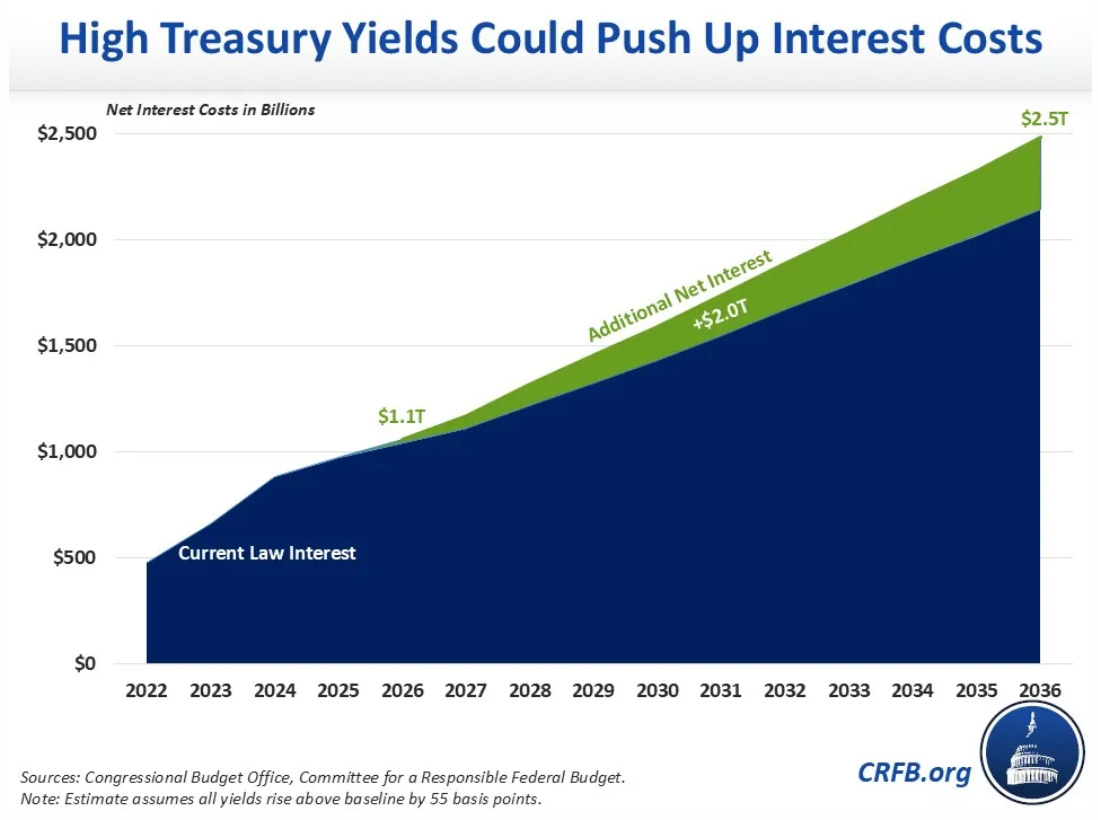
This brings us to the fiscal calamity steaming down the pike. Even with only a modest further increase in inflation and interest rates, the interest cost on the US debt is surging toward the stunning level of $2.5 trillion per year.
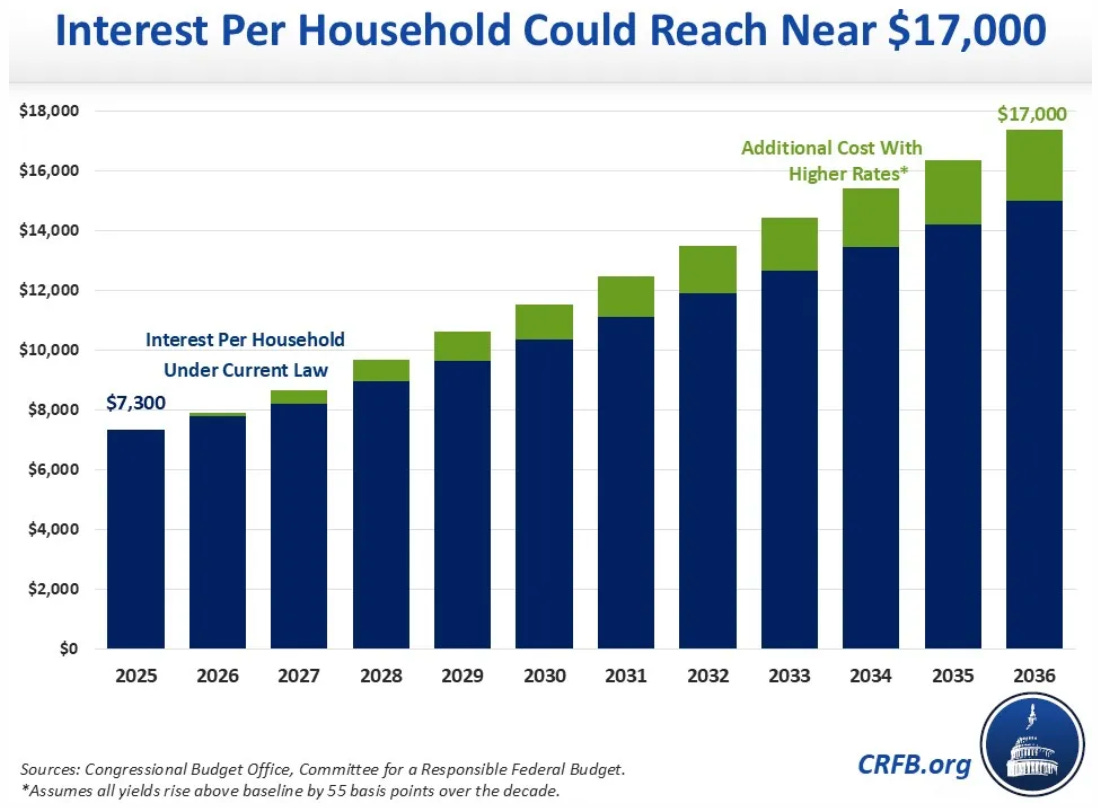
To bring this staggering number down to earth, here are the same figures broken out on a per household basis. By the end of the current 10-year window, the annual interest cost on the federal debt alone will amount to $17,000 for every household in America.
As we will show in Part 2, the above scenario is pretty much baked into the cake because the interest-expense plus entitlements and Defense are driving the annual deficit to 9% of GDP by 2056 compared to the already bloated level of just under 6% presently.
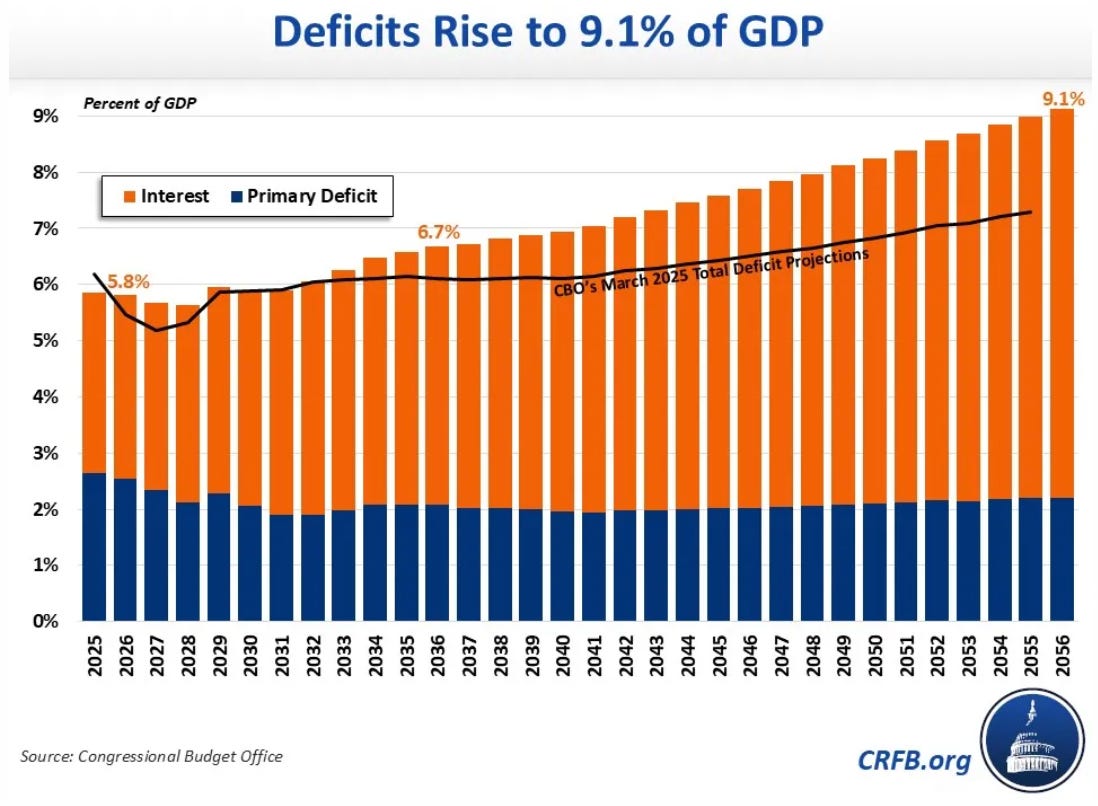
In turn, math is math. A string of deficits of this size stretched out for the next three decades will cause a massive compounding of the public debt outstanding. As shown below, it will hit 175% of GDP under the baseline deficit scenario depicted above, meaning in plain dollars and cents a public debt of $150 trillion by 2056.
Needless to say, the financial markets would likely plunge into terminal collapse long before the $150 trillion debt mark is reached in an aging economy in which War spending and Welfare spending have become a Fiscal Doomsday Machine. So in Part 2 we will amplify why this outcome is nearly impossible to avoid given the fact that the once and former opposition party, know as the GOP, has now been Trumpified into the “me too” party of spend, borrow and print.
In fact, the Donald’s hideous destruction of Washington’s #1 fiscal stalwart by any measure, Congressman Tom Massie, all but sealed the deal.
https://davidstockman.substack.com/p/fiscal-disaster-ahead-why-massies